How to Calculate Churn Rate (Every Formula, With Worked Examples)
Calculate churn rate with real arithmetic: customer churn, revenue churn, gross vs net MRR churn formulas, and the monthly-to-annual compounding gotcha.
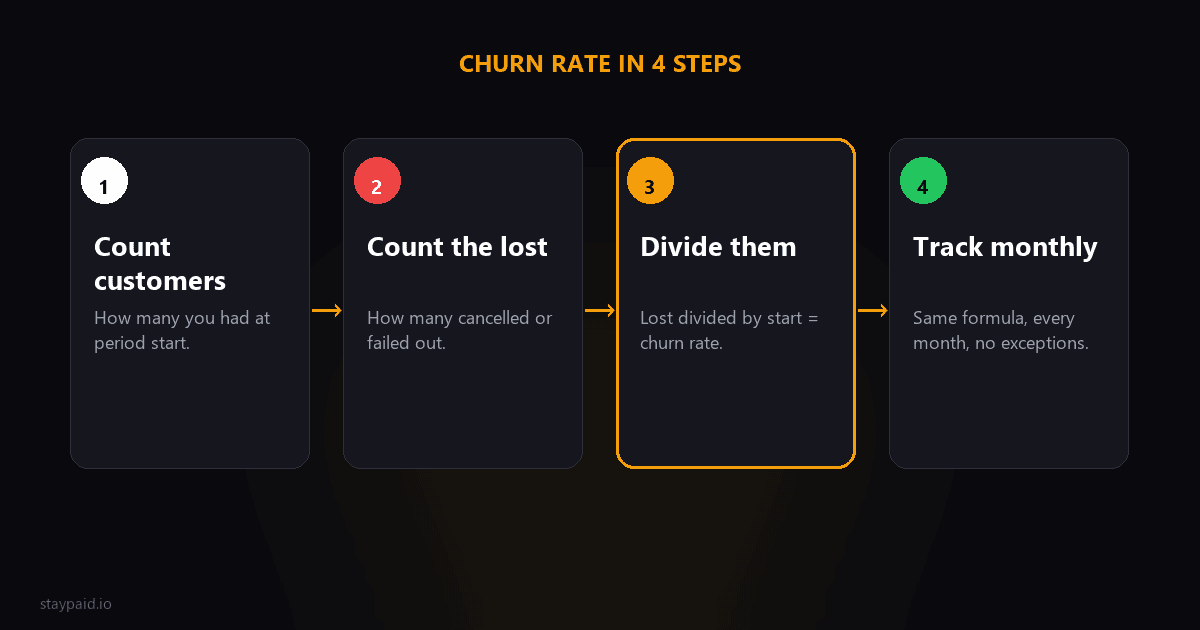
Churn rate is the percentage of customers or revenue you lose over a given period. The basic formula fits on one line: divide what you lost by what you started with, then multiply by 100. But there are several variations — customer churn, revenue churn, gross vs net — and they tell you different things about your business.
This post walks through each formula with the arithmetic shown step by step, so you can calculate your own numbers and understand what they actually mean.
Customer churn rate (logo churn)
Customer churn — also called logo churn — is the simplest and most commonly cited metric. It answers the question: what fraction of my paying customers canceled this period?
The formula is:
"Customer Churn Rate = (Customers Lost During Period / Customers at Start of Period) × 100"
Let's run it with real numbers. Say you start the month with 200 paying customers. During the month, 12 customers cancel and do not come back. Your customer churn rate is:
(12 / 200) × 100 = 6% monthly churn.
That 6% means for every 100 customers you had at the start of the month, you lost roughly 6 by the end. If this rate holds steady, you will lose about half your customer base over the course of a year (more on the annual conversion math in a minute).
A second example to lock it in. You start with 500 customers and lose 15. That works out to (15 / 500) × 100 = 3% monthly churn. Half the rate of the first example, which translates to a meaningfully longer average customer lifetime.
Revenue churn rate (MRR churn)
Customer churn treats every customer equally. Revenue churn does not. Losing five customers paying $10 each is very different from losing one customer paying $5,000, and revenue churn captures that difference.
The formula uses monthly recurring revenue (MRR) instead of customer count:
"Revenue Churn Rate = (MRR Lost from Cancellations and Downgrades / MRR at Start of Period) × 100"
Here is a worked example. You start the month with $25,000 in MRR. During the month, cancellations cost you $1,200 and downgrades cost you another $400, for a total of $1,600 in lost MRR. Your gross revenue churn is:
($1,600 / $25,000) × 100 = 6.4%.
Gross vs net revenue churn
The calculation above is gross revenue churn — it only looks at what you lost. But during that same month you likely also gained revenue from existing customers: upgrades, plan expansions, and reactivations. Net revenue churn factors those in.
Net Revenue Churn = ((MRR Lost − Expansion MRR) / MRR at Start) × 100
Using the same numbers: you lost $1,600 in MRR but also gained $300 from existing customers upgrading plans. Your net revenue churn is:
(($1,600 − $300) / $25,000) × 100 = ($1,300 / $25,000) × 100 = 5.2%.
Net revenue churn can even go negative — meaning your expansions from existing customers exceed your losses — which is a signal that your business has strong product-market fit. Many usage-based SaaS companies report negative net revenue churn as a point of pride. But for most early-stage SaaS, net revenue churn is still positive, and gross revenue churn shows you the raw leak you need to plug.
Putting it together: one business, two lenses
Let me show you why running both customer and revenue churn matters. Imagine a SaaS company called Flowboard (fake name, real scenario). Here are their numbers for the month:
- •Started the month with 400 customers and $32,000 MRR.
- •Lost 12 customers to cancellation. Those 12 customers represented $1,800 in combined MRR.
- •Had 4 customers downgrade from the $99 plan to the $49 plan, losing $200 in MRR total.
- •Had 6 customers upgrade from $49 to $99, adding $300 in expansion MRR.
Let's run both formulas.
Customer churn rate: (12 / 400) × 100 = 3%. That seems manageable — only 3% of customers left.
Gross revenue churn: (($1,800 + $200) / $32,000) × 100 = ($2,000 / $32,000) × 100 = 6.25%. That is more than double the customer churn rate. Why? Because the customers who left were on higher-than-average plans. Customer churn told you the quantity of the problem; revenue churn told you the severity.
Net revenue churn: (($2,000 − $300) / $32,000) × 100 = ($1,700 / $32,000) × 100 = 5.3%. Still positive, but the upgrades cushioned the blow. If Flowboard had focused only on customer churn, they might think they are doing fine at 3% while actually bleeding over 6% of their revenue each month.
This is the real value of running more than one churn metric. They disagree, and that disagreement is information.
Monthly to annual churn (the compounding gotcha)
The most common mistake I see is multiplying a monthly churn rate by 12 to get an annual figure. A 5% monthly churn rate is not 60% annual. It is roughly 46%. Here is why.
Churn compounds because the same base of customers is at risk each month. You cannot simply add monthly rates — you have to account for the fact that the pool shrinks. The correct formula is:
"Annual Churn Rate = 1 − (1 − Monthly Churn Rate)^12"
Let's run it with the 5% example. First convert 5% to decimal form: 0.05. The survival rate per month is 1 − 0.05 = 0.95. Raise that to the 12th power: 0.95^12 = 0.5404. That is the fraction of customers who survive a full year. Subtract from 1 to get the fraction who churn: 1 − 0.5404 = 0.4596, or 46%.
The difference is significant. Saying 60% annual churn when the real number is 46% overstates your churn by about 30% — and the gap widens at higher rates. A 10% monthly rate compounds to about 72% annually, not 120%.
For the earlier example with 3% monthly churn: 1 − (1 − 0.03)^12 = 1 − 0.97^12 = 1 − 0.6938 = 30.6% annual. That small difference in monthly rate (3% vs 5%) nearly doubles your annual retention, which is why tiny churn improvements compound into big revenue gains over time.
Common mistakes when calculating churn
- •Counting trial users as customers. Trial users have not paid and have a much higher drop-off rate. Include them and your churn rate looks artificially low because your denominator is inflated. Track trial-to-paid conversion separately.
- •Mixing monthly and annual plans without normalizing. If you have both monthly and annual subscribers, convert annual churn back to a monthly equivalent before averaging, or calculate each cohort separately. Annual subscribers churn less frequently by design, and lumping them with monthly subscribers understates your monthly churn.
- •Forgetting to subtract expansion MRR in net revenue churn. Gross and net tell different stories, and using the wrong one for your narrative can hide problems. Gross shows the raw leak; net shows whether your existing customer base is growing or shrinking in value.
- •Using average customers instead of starting customers. The denominator should be customer count at the beginning of the period, not an average. Averaging muddies the picture and makes month-over-month comparison less reliable.
Which churn metric should you track?
Track all three, but focus on different ones depending on where your business is.
- •Early-stage (under $10k MRR): Watch customer churn rate weekly. You do not have enough customers for revenue-churn segmentation to be statistically useful yet. If you have 100 customers and lose 3, that is a big deal regardless of their plan size.
- •Growth stage ($10k–$100k MRR): Add gross revenue churn. At this stage, plan sizes vary enough that losing the wrong customer can hurt disproportionately. Track both logo and revenue churn side by side.
- •Scale stage ($100k+ MRR): Watch net revenue churn monthly. If your expansions reliably offset losses, you have a self-healing revenue model. If not, gross revenue churn shows the gap you need to close with retention or upsell initiatives.
No matter which stage you are in, I recommend running the numbers through a calculator so you can quickly test different scenarios. We built a free SaaS churn rate calculator at /churn-calculator that handles customer churn, revenue churn, and the monthly-to-annual conversion so you do not have to do the exponent math by hand.
The takeaway
Churn rate is one of the most important numbers in your SaaS, but only if you calculate it consistently and understand which variant you are looking at. Customer churn shows you how many people are leaving. Revenue churn shows you how much it costs. Net revenue churn shows you whether your existing customers are becoming more or less valuable over time.
And please do not multiply by 12. Use the compounding formula. Your investors will notice.
FAQ
How do I calculate monthly churn rate?
Divide the number of customers who canceled during the month by the number of customers you had at the start of the month, then multiply by 100. For example, if you start January with 500 customers and lose 15, your monthly churn rate is (15 / 500) x 100 = 3%.
What is the difference between gross and net revenue churn?
Gross revenue churn ignores upgrades and expansions — it is the revenue lost from cancellations and downgrades divided by starting MRR. Net revenue churn subtracts expansion MRR (upgrades, reactivations) from the lost revenue before dividing. Net revenue churn can be negative if expansions exceed losses, which is common in usage-based SaaS.
How do I convert monthly churn to annual churn?
Use the compound formula: 1 - (1 - monthly_churn_rate)^12. Do not multiply by 12. A 5% monthly churn rate works out to about 46% annual churn, not 60%, because the same customers are at risk each month and some would have churned regardless.
Should I include trial users in my churn calculation?
No. Only count paying customers. Trial users have not yet proven willingness to pay, and including them inflates your denominator which makes churn look artificially low. Track trial-to-paid conversion separately.
Keep reading
Robert
Founder at StayPaid
Want to recover failed payments like a founder?
Start Free — First 3 recoveries