Average SaaS Churn Rate in 2026: Benchmarks by Stage and Pricing Model
Honest SaaS churn benchmarks by stage and pricing model — typical ranges for early, growth, and mature companies, plus the voluntary vs involuntary split.
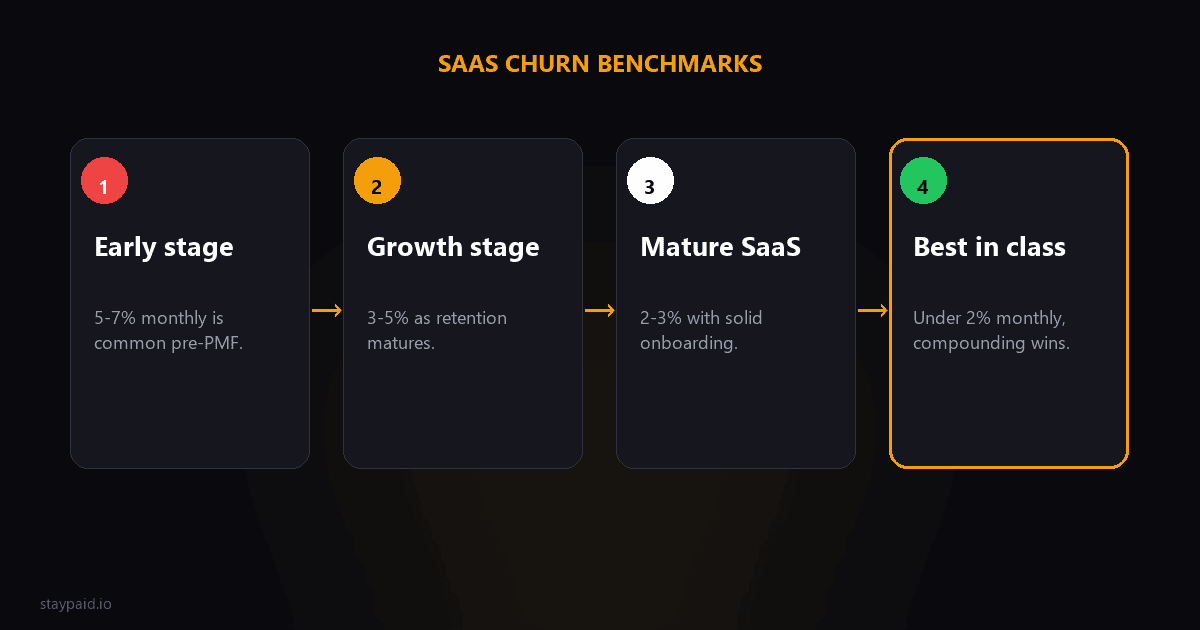
If you search for "average SaaS churn rate" you'll get a hundred different numbers. Some posts say 5% monthly is normal. Others say anything above 3% is a crisis. They're all working from different data sets and different definitions, which makes the whole thing useless unless you know what question you're actually asking.
Here is what I've found after digging through the commonly cited industry studies — Recurly's benchmark report, Pacific Crest's surveys, and data from Stripe's published research — plus what I've seen running my own SaaS. The numbers are ranges, not absolutes, because your churn depends on who you sell to, how much you charge, and how old your company is. A one-person side project and a VC-backed sales org will have very different baselines, and pretending otherwise helps nobody.
The short answer first
Most B2B SaaS companies see monthly churn rates between 3% and 7%. B2C SaaS tends to run higher — 5% to 10% or more. The annual equivalent, depending on how you calculate it, typically falls between 30% and 70%. But the real answer is "it depends," and the best benchmark is your own trend over time.
Churn by company stage
A company with 20 customers and a company with 2,000 customers do not have the same churn profile. The stage of your business changes what a "normal" number looks like. Here are the rough bands I see consistently across published reports:
Early stage (pre-product-market fit, under $100k ARR)
Monthly churn of 5% to 10% is common. Some companies run even higher. At this stage you are still figuring out who your real customer is, and a lot of the people who signed up early were never a great fit. High churn is painful, but it is also signal — it tells you which segments to stop selling to. The goal is to get below 5% monthly before you start scaling paid acquisition.
Growth stage ($100k–$2M ARR)
Monthly churn typically settles into the 3% to 5% range. This is where most B2B SaaS companies live. At this stage you have product-market fit for at least one customer segment, and churn becomes more about pricing, support, and payment failures than about product fit. A company in this range that drops below 3% monthly is doing well.
Mature stage ($2M+ ARR, established brand)
Monthly churn of 1% to 3% is typical. Some mature enterprise SaaS companies report below 1% monthly, especially if they have long contracts and high switching costs. But many mature companies also deal with expansion revenue and contraction (downgrades), which means gross revenue churn can look different from logo churn. Below 1% monthly is not the default — it is an achievement.
Churn by pricing model
How you charge matters as much as what you build. Here are the patterns I see in the data:
- •B2C SaaS (individual consumers, $5–$30/mo): Monthly churn 5%–12% is common. Consumers churn freely because switching is frictionless. Retention efforts here are about habit-building, not contracts.
- •B2B SMB (small businesses, $30–$200/mo): Monthly churn 3%–7% is typical. SMBs churn for three main reasons: they went out of business, their card expired and they never noticed, or the product wasn't worth the price. The middle one is recoverable.
- •B2B Mid-Market ($200–$2,000/mo): Monthly churn 2%–4%. These customers have usually invested time in setup and training, so they are stickier. But they also have procurement policies that can cause payment delays and involuntary churn.
- •B2B Enterprise ($2,000+/mo, often annual contracts): Monthly churn 1%–2% or lower. Annual contracts mask a lot of churn — the real test comes at renewal. Enterprise churn numbers look great until the contract ends.
- •Usage-based / seat-based pricing: Churn is harder to define because customers may shrink usage without cancelling. Look at contraction rate alongside cancellation rate to get the full picture.
The voluntary vs involuntary churn split
This is the part most benchmark posts miss entirely. Not all churn is the same. When someone actively cancels — clicks "Delete my account" — that is voluntary churn. When their card is declined, expires, or their bank blocks the charge and they never come back, that is involuntary churn. They are different problems with different solutions.
Industry data — including Stripe's own research and surveys from the dunning space — suggests that involuntary churn accounts for roughly 20% to 40% of total monthly churn for subscription businesses. That is a meaningful chunk. And here is the important part: involuntary churn is often recoverable. A well-timed dunning sequence can recover 40% to 80% of those lost customers. Voluntary churn requires product changes and pricing strategy — no email sequence can fix someone deciding your product is not worth it. The two types look the same in your MRR chart but they demand completely different responses.
"If your monthly churn is 6% and 30% of that is involuntary, you are losing about 1.8% of your customer base every month to failed payments alone. That is frequently the easiest money you can recover."
This is why tracking logo churn without splitting it into voluntary and involuntary can mislead you. If your overall churn rate drops after you add a dunning sequence, you have not fixed your product — you have just stopped leaking customers out the back door. That is still a win, but it is a different kind of win, and you should know which one you are celebrating.
What "good" looks like for a small SaaS
If you are an indie founder or a small team, ignore the enterprise benchmarks. They do not apply to you. Here is a more useful target:
- •Monthly churn below 5% — you are in a healthy range for a small B2B SaaS. Focus on keeping it trending down.
- •Monthly churn below 3% — you are doing well. Most of your churn is probably the involuntary kind, which is the recoverable kind.
- •Monthly churn below 1% — you are an outlier. If you are genuinely below 1% monthly as a small SaaS, congratulations and also check your math. Are you counting expansion and contraction? Are annual contracts masking cancellations?
The most honest benchmark I can give you is this: if your churn rate is decreasing quarter over quarter, you are on the right track regardless of the absolute number. A 7% monthly churn that was 10% last quarter is better than a flat 3% that is not moving. Trends tell you more than snapshots, especially when you are under 1,000 customers and the law of small numbers makes every lost customer look dramatic.
How to compare your number honestly
When you read a benchmark post — including this one — ask yourself three questions before you react:
- •Are they reporting logo churn (customer count) or revenue churn (MRR lost)? These can disagree wildly. Losing ten $10/mo customers looks different from losing one $1,000/mo customer.
- •Is the churn number gross (all losses) or net (losses minus expansion from existing customers)? Net revenue churn can be negative for companies that upsell successfully, which makes their churn look artificially low.
- •Is the data from public companies (usually enterprise, low churn) or a venture dataset (anyone funded) or a self-selected survey (anyone with an email list)? Each sample biases the number differently.
The averages you see online are aggregates from different populations. Your job is not to match an average. Your job is to understand your own number and push it in the right direction.
Where churn recovery fits in
I built StayPaid specifically for the involuntary churn piece. Not because I think that is the only churn that matters, but because it is the piece a one-person team can actually fix without rebuilding their product. A good dunning setup — a few personal recovery emails spaced over a week or two, reviewed by a human before sending — can pull a meaningful percentage of those 20% to 40% back. The rest of churn is a product conversation, not a tool conversation.
The bottom line: the average SaaS churn rate is somewhere between 3% and 7% monthly, and that range is so wide it is almost unhelpful. What matters is your trend, your voluntary vs involuntary split, and whether you are recovering the customers who wanted to stay but got blocked by a payment glitch.
FAQ
What is a good monthly churn rate for SaaS?
For most B2B SaaS companies a monthly churn rate under 3% is considered healthy, under 2% is strong, and under 1% is world-class. Early-stage companies often run higher — between 5% and 10% monthly — until they find product-market fit. The number that matters most is your own trend, not an aggregate. If your churn rate is trending down quarter over quarter, that is usually more meaningful than a static benchmark.
What is the average annual churn rate for SaaS?
Annual churn rates vary widely. For B2B SaaS the commonly cited range is 30% to 70% annually when converted from monthly rates (the math is compounding, so a 5% monthly churn comes out to roughly 46% annual). B2C SaaS runs higher — sometimes 70% or more annually. Always check whether someone is reporting logo churn or revenue churn; they can look very different for the same company.
Why does the voluntary vs involuntary churn split matter?
Because involuntary churn — failed payments, expired cards, bank blocks — is often the most recoverable piece of your churn. Studies from Stripe and the dunning industry suggest involuntary churn accounts for roughly 20% to 40% of total monthly churn. A meaningful portion of that can be recovered with a respectful email sequence. Voluntary churn (the customer actively cancelled) requires a product fix, and no dunning tool can solve that.
How do I calculate my churn rate accurately?
Use a consistent formula each month: customers lost in the month divided by total customers at the start of the month. Exclude new signups from the denominator. Track logo churn (customer count) and MRR churn (revenue lost) separately — they tell different stories. Free trials should not count as lost customers unless they never converted. Our free churn calculator handles all the formulas if you want to skip the spreadsheet.
Keep reading
Robert
Founder at StayPaid
Want to recover failed payments like a founder?
Start Free — First 3 recoveries