Revenue Churn vs Logo Churn vs MRR Churn — What Each One Actually Tells You
Logo churn counts customers lost. Revenue churn counts dollars lost. When each matters, how they disagree, with a worked example.
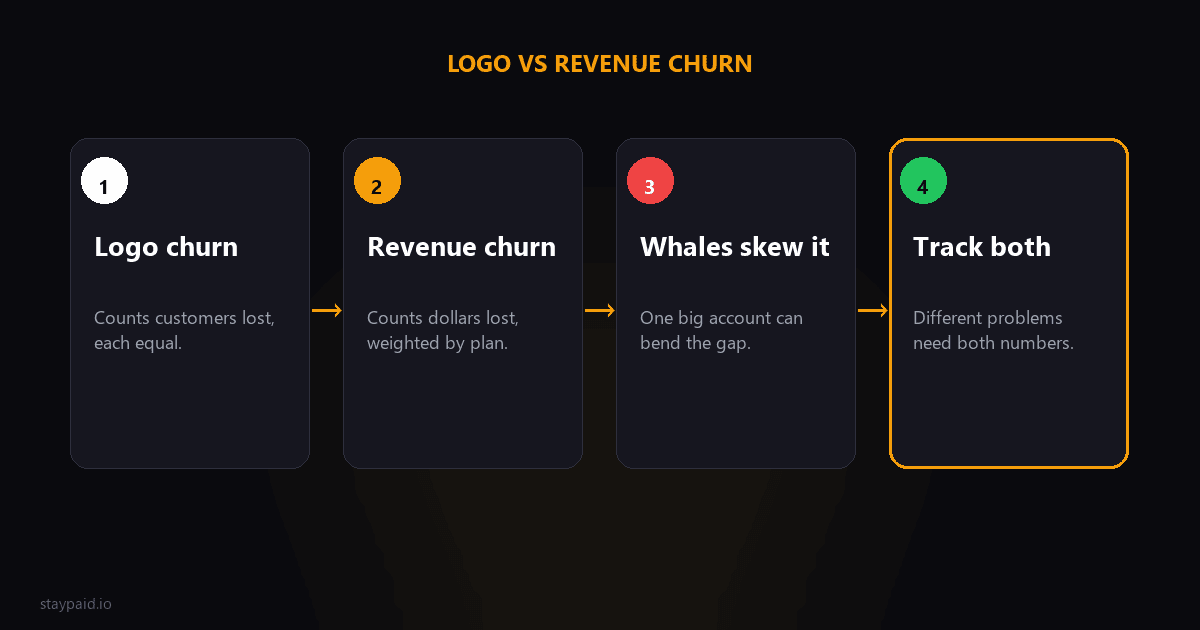
Revenue churn, logo churn, and MRR churn measure the same thing from different angles — and they often disagree
Logo churn counts how many customers you lost. Revenue churn counts how much revenue you lost. MRR churn tracks lost revenue as a percentage of your recurring base. When you are running a small SaaS, the gap between these three can save you from a bad decision or lead you straight into one, depending on which number you check.
- •Logo churn (customer churn) — the percentage of customers who cancelled in a period. Simple, intuitive, but blind to revenue differences. A $29 customer and a $999 customer count the same.
- •Gross revenue churn (gross MRR churn) — the MRR lost to cancellations and downgrades divided by starting MRR. Tells you how much money actually walked out the door, regardless of how many people left.
- •Net revenue churn (net MRR churn) — gross MRR lost minus new MRR from upgrades and new customers, divided by starting MRR. The most complete metric because it accounts for growth inside your existing base alongside the losses.
Meet Flowboard — our worked example
Flowboard is a fictional B2B SaaS that sells project dashboards. It has 200 customers and $15,000 in monthly recurring revenue at the start of the month. Here are the actual numbers for the month:
- •8 customers cancelled — 7 on the $29/mo plan ($203 total) and 1 on the $699/mo plan ($699). Total cancellation loss: $902.
- •2 customers downgraded from $79/mo to $29/mo. Total contraction loss: $100.
- •5 new customers signed up at $29/mo. Total new MRR: $145.
- •2 customers upgraded from $19/mo to $49/mo. Total expansion MRR: $60.
Logo churn: 4.0%
Logo churn is customers lost divided by customers at the start. Flowboard started with 200 customers and lost 8: 8 ÷ 200 = 4.0%. That is clean, intuitive, and easy to report. It tells you that 4 out of every 100 customers left this month — a number that looks reasonable for a small B2B SaaS. But look at what the logo churn number hides. The 7 customers on the $29 plan and the 1 customer on the $699 plan count exactly the same: one customer each. Losing the whale costs you 24 times as much revenue as losing one small-plan customer, but logo churn treats them identically. If you only track logo churn, you can miss a serious revenue problem until it is too late.
Gross revenue churn: 6.68%
Gross revenue churn (also called gross MRR churn) is the MRR lost to cancellations and downgrades divided by starting MRR. For Flowboard, that is $902 from cancellations plus $100 from downgrades — $1,002 total lost MRR — divided by $15,000 in starting MRR: $1,002 ÷ $15,000 = 6.68%. Now the picture changes meaningfully. Logo churn said 4.0%, which looks acceptable. Gross revenue churn says 6.68%, which is substantially higher. The difference is almost entirely due to that one $699/mo customer. That single lost account represents about 70% of total lost MRR ($699 ÷ $1,002), even though it was just 1 out of 8 lost customers. The whale matters.
This is the most common scenario where logo churn and revenue churn diverge — a small SaaS loses one or two mid-tier accounts, and the revenue damage is way out of proportion to the customer count. If you have multiple pricing tiers or usage-based billing, this gap can be even wider.
Net revenue churn: 5.31%
Net revenue churn takes gross revenue churn and subtracts new MRR from upgrades and new customers, then divides by starting MRR. This gives you the truest picture of whether your existing business is growing or shrinking. For Flowboard: $1,002 in gross losses minus $145 from new signups and $60 from upgrades — $205 in new MRR total — equals $797 in net lost MRR. $797 ÷ $15,000 = 5.31%. The net rate of 5.31% is better than the gross rate of 6.68% because Flowboard is adding back some revenue through expansions and new customers. But it is still above the 4.0% logo churn rate. That gap tells you something important: Flowboard is leaking revenue even after accounting for new business. Growth is happening, but it is not keeping up with the loss.
Why the three disagree
These three metrics disagree because they answer different questions. Logo churn asks, "are people leaving?" Gross revenue churn asks, "is revenue leaving?" Net revenue churn asks, "is the existing business growing or shrinking?" A healthy SaaS can have all three pointing in different directions, and that is not necessarily a problem — it is just information you need to interpret correctly. In Flowboard's case, the gap between logo churn (4.0%) and gross revenue churn (6.68%) is a red flag. It means the revenue per lost customer is higher than the average — you are losing bigger accounts disproportionately. That is a scarier signal than "a few people cancelled." It suggests your higher-value customers are at risk, which is a different problem from losing the cheap seats.
When do they agree? When your customer base is homogeneous — all on the same plan at the same price. In that case logo churn and gross revenue churn track close together because each lost customer represents roughly the same revenue. But as soon as you have multiple pricing tiers, the gap opens up. Most SaaS companies have a long tail of small accounts and a handful of larger ones, which is exactly the scenario where the three metrics tell different stories.
Which one should you watch?
Here is how I think about this for a small SaaS:
- •Watch logo churn weekly as a health signal. If it spikes, something is systemic — broken onboarding, price issues, product-market fit drift. Investigate fast.
- •Watch gross revenue churn monthly. This is where the real damage shows up. A single lost whale can ruin your month even if everyone else stayed. If this number is above 5%, you have a revenue problem that logo churn will not show you.
- •Watch net revenue churn quarterly. It is the most lagging indicator but also the truest. Negative net revenue churn — where expansion exceeds loss — is the gold standard for SaaS, though rare until you have enough customers that upgrades become a reliable force.
I also recommend tracking involuntary churn separately. Failed payments show up as cancellations in all three metrics, but they are often recoverable. A dunning tool like StayPaid catches those failed payments before they turn into lost customers and lost MRR. Involuntary churn inflates every metric equally, but it is the easiest type of churn to fix.
Gross vs net revenue churn in more detail
If your SaaS has meaningful expansion revenue — upgrades, add-ons, seat expansions, usage growth — net revenue churn can be significantly lower than gross. Some mature SaaS companies report negative net revenue churn, meaning their existing customers are spending more each year, more than offsetting the customers who leave. But for a small SaaS without a lot of upsell surface, net revenue churn tends to track close to gross. That is normal. The important thing is to measure both so you know whether your growth from existing customers is real. If gross is fine but net is bad, your expansion is weak or your new customers are too small. If gross is bad but net is fine, new revenue is papering over a leak — and that leak will hurt you eventually.
"If you only watch one churn metric, watch gross revenue churn. Logo churn is too forgiving. Net revenue churn can mask problems by counting future growth against today's losses. Gross revenue churn gives you the honest number: how much money actually left this month."
The point is not that one metric is right and the others are wrong. They show you different parts of the same problem. Watch all three, understand where each one is blind, and you will make better decisions about pricing, retention, and where to focus your energy as a founder. If you see a gap between logo churn and revenue churn that you cannot explain, check your involuntary churn rate. It is often the hidden factor — customers whose cards failed through no fault of their own. Those are not real cancellations. They are opportunities to recover revenue with a human email and a second chance.
If you use Stripe, you can pull all three metrics from your dashboard in about ten minutes. Export your monthly subscription report for starting MRR and customer count, filter cancelled subscriptions for logo churn, use invoice data for gross MRR loss, and add upgrades and new subscriptions for net MRR. Tracking them side by side over time will tell you more about your business than any single number ever could.
FAQ
Can you have low logo churn but high revenue churn?
Yes, absolutely. If you lose one $1,000/mo customer but keep 99 customers paying $10/mo, logo churn is 1% but gross revenue churn is about 50%. The metrics disagree because they measure different things — bodies versus dollars. This is most common when you have multiple pricing tiers or a few large accounts.
Should I track gross or net revenue churn?
Track both. Gross revenue churn tells you how much revenue you are leaking from cancellations and downgrades. Net revenue churn subtracts expansion from upgrades and new customers, so it shows whether your existing customer base is growing or shrinking overall. If the gap between them is large, find out why — it could be good (strong expansion) or bad (new revenue hiding a leak).
What is a healthy net revenue churn for a small SaaS?
Under 5% gross monthly revenue churn is typical for B2B SaaS. For net revenue churn, negative numbers (expansion exceeding contraction) are the ideal but rare at small scale. Under 2% net monthly churn is considered healthy, and under 1% is very strong. For consumer SaaS these numbers are typically higher — 5-10% monthly is common.
How does involuntary churn affect logo and revenue churn?
Involuntary churn — failed payments that are not the customer's fault — inflates both metrics equally because each lost customer also means lost dollars. The difference is that involuntary churn is recoverable. Those customers did not choose to leave. Fixing your dunning process can improve both logo churn and revenue churn at once without changing your product or pricing.
Keep reading
Robert
Founder at StayPaid
Want to recover failed payments like a founder?
Start Free — First 3 recoveries