Why Is My SaaS Churn Rate So High? A Diagnostic for Founders (Before You Panic)
Churn rate way above the benchmarks? Run this diagnostic first — most 'high churn' is a bad comparison, blended numbers, or fixable failed payments.
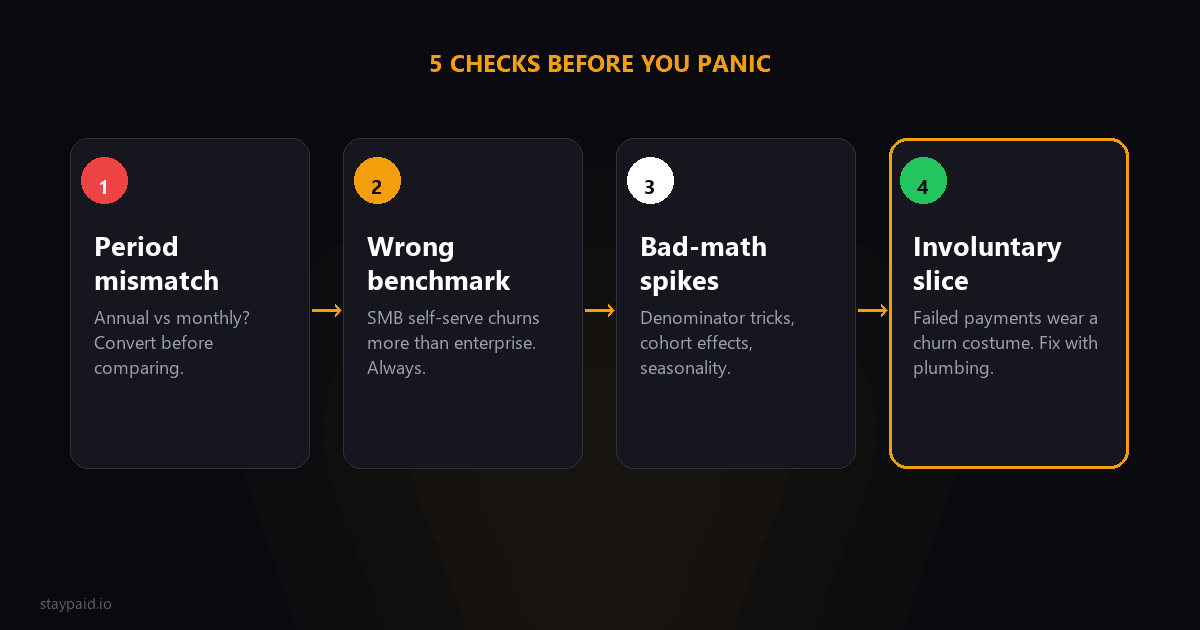
First: breathe, then check the comparison
A SaaS churn rate usually looks 'too high' for one of five reasons: you're comparing periods wrong, you're comparing against the wrong companies, you're blending voluntary and involuntary churn, you have a real product problem, or you have a real billing problem. Three of those five are measurement issues, not business issues. Diagnose in that order.
I've watched founders spiral over a churn number that turned out to be fine once the math was done honestly. And I've watched others ignore a genuinely bad number because 'benchmarks are fuzzy anyway.' Both mistakes are expensive. Here's the checklist.
Check 1: Are you comparing monthly to annual?
This is the single most common false alarm. Benchmark posts quote annual churn — 'good SaaS churns 3-5% annually' — and founders compare it against their monthly Stripe dashboard number. That's not a comparison, that's a unit error.
The conversion isn't multiplication. 0.5% monthly churn compounds to about 5.8% annually (1 minus 0.995 to the power of 12). 3% monthly is about 30.6% annually. So if your dashboard says 4% monthly and a benchmark says 5% annually, you're not close to benchmark — you're at 38% annual and it's bad. But if your dashboard says 0.5% monthly and you're panicking about a 3.5% benchmark, you're actually beating it. Do the conversion before doing anything else.
Check 2: Are you the company the benchmark describes?
- •Stage: pre-PMF SaaS churns brutally and that's the cost of finding fit. Comparing your seed-stage number to a Series C company's is pointless.
- •Price point: a $9/month product churns multiples more than a $900/month product. Cheap plans attract tire-kickers who leave without ceremony.
- •Market: SMB self-serve churns more than mid-market, which churns more than enterprise. If the benchmark is enterprise-weighted and you sell to freelancers, you were never going to match it.
A 7% monthly churn rate is a crisis for one business and Tuesday for another. The honest benchmark is companies at your stage, your price point, your market — and those numbers are harder to find, which is exactly why the lazy comparisons spread.
Check 3: Split voluntary from involuntary (the big one)
Your churn number blends two completely different phenomena: customers who decided to leave, and customers whose payment failed and never got fixed. For most subscription businesses, the second group is a substantial slice — and it is not a verdict on your product.
Pull your churned customers from last quarter. Sort them: clicked-cancel vs died-unpaid. The died-unpaid group — expired cards, empty accounts, ignored dunning emails — is involuntary churn, and most of it was recoverable with retries plus a real email. Founders who run this split regularly discover their 'product problem' is half billing problem. Fixing billing is a weekend. Rebuilding a product is a quarter.
Check 4: If it's voluntary — find the moment it happens
When the split says your churn is mostly deliberate, the next question is when customers leave. Plot tenure at cancellation:
- •Leaving in week one: onboarding or expectation problem. They never got to the value. That's fixable with a better first-run experience, not a better product.
- •Leaving at month 2-3: the honeymoon ended and the product didn't earn a habit. This is a genuine product-value problem.
- •Leaving after a year: natural turnover, outgrew you, champion left the company. Some of this is structural and fine.
And talk to them. A three-question cancel survey plus five actual conversations will tell you more than any dashboard. The pattern emerges fast: it's usually one reason, said twenty different ways.
A note on timing: when churn spikes are seasonal, not structural
Before you redesign anything, check the calendar. January churns (budget audits, new-year tooling reviews). August churns (half your customers are on vacation and the other half is cutting costs). Annual-plan anniversaries cluster cancellations exactly one year after your launch spike. A churn spike that lines up with one of those is weather, not climate — note it, watch next month, and don't rebuild the product over a seasonal pattern.
The tell: structural problems trend; seasonal problems repeat. If last year's August looked exactly like this year's August, you don't have a new problem. You have an old calendar. Pull the same month from last year before you pull the emergency brake.
Check 5: If it's involuntary — the fix is boring and fast
- •Confirm your card updater is working (check the payment_method.automatically_updated events, not vibes).
- •Turn on pre-dunning for expiring cards — the cheapest saves you'll ever make.
- •Audit your retry schedule: enough attempts for soft declines, none wasted on hard declines.
- •Read your dunning emails as if you were the customer. If they read like a court summons from no-reply@, rewrite them or get a human into the loop.
A worked example: the 8% that was really 4%
Walk through it with real-feeling numbers. A B2B SaaS with 300 customers sees 24 leave in a month: 8% monthly churn, and the founder is comparing it against a blog post claiming 3.5% is 'industry average.' Panic ensues.
Now run the diagnostic. First, the 3.5% benchmark turned out to be annual churn for mature companies — against that yardstick, 8% monthly compounds to roughly 63% annual, so the comparison was nonsense twice over. Second, the split: of the 24 leavers, 10 ended unpaid after failed payments. Voluntary churn was actually 14 customers — 4.7% monthly. Third, the voluntary split by tenure: 9 of the 14 left in their first 60 days. The 'churn problem' is really an onboarding problem plus a billing problem, and neither requires rebuilding the product.
That company went from 'we have a churn crisis' to 'we have two specific, fixable problems' in one afternoon of honest math. That's what the diagnostic is for.
The uncomfortable possibility
Sometimes you run all five checks and the answer is the one you didn't want: the number is real, the comparison is fair, and customers are leaving on purpose because the product isn't worth staying for. That's not a churn problem anymore — it's a product-market-fit problem, and no dunning stack will save it. The good news: at least now you know, and you stopped burning months fixing the wrong thing.
One last thing that helps more than it should: write the diagnostic down. Five checks, one page, the numbers you found at each step. Founders re-panic about churn every quarter, and the written version turns next quarter's spiral into a ten-minute review of last quarter's notes. Churn anxiety is recurring; your analysis should be reusable.
The takeaway
Before you panic about a high churn rate: convert the periods, check the comparison group, split voluntary from involuntary, and only then decide what to fix. Most scary churn numbers contain a large, fixable, boring billing component — and finding it is a much better use of your weekend than rewriting your onboarding on a hunch.
The involuntary slice is the one that responds to effort this week. StayPaid handles exactly that: failed payments get a personal recovery email from your address, you approve what goes out, and customers who never wanted to leave get a reason to stay. The rest of the diagnostic is yours to run — the calculator and benchmark posts will help.
FAQ
Why is my B2B SaaS churn at 8% when the industry average is 3.5%?
Check the comparison before the product. That 3.5% figure is usually annual logo churn for mature companies — if your 8% is monthly, includes failed-payment churn, or you're early-stage, you're not comparing the same thing. An 8% monthly number that includes involuntary churn might contain only 4-5% of customers who actually chose to leave.
What is considered a high churn rate for SaaS?
Context-dependent, but rough guide: above 5-7% monthly customer churn is high for established B2B SaaS, while early-stage and low-price products routinely run 5-8% monthly and survive. High becomes dangerous when it stays high after you have product-market fit and a clean billing stack.
Can failed payments make my churn rate look worse than it is?
Absolutely. Involuntary churn from failed payments often makes up a large share of total churn for subscription businesses. Most of those customers never decided to leave — their card did. Separating this out usually drops the 'real' churn number significantly.
How do I find out why customers are actually leaving?
Split churned customers into cancelled vs payment-failed, then talk to both groups. Cancel-flow surveys capture the deliberate leavers. The failed-payment group just needs their card fixed — email them like a person and many come back, which tells you it was never really churn.
Keep reading
Robert
Founder at StayPaid
Want to recover failed payments like a founder?
Start Free — First 3 recoveries