Retention Rate: The Formula, a Worked Example, and When It Lies to You
The retention rate formula with a worked example, the cohort version, and three situations where the standard calculation lies to you.
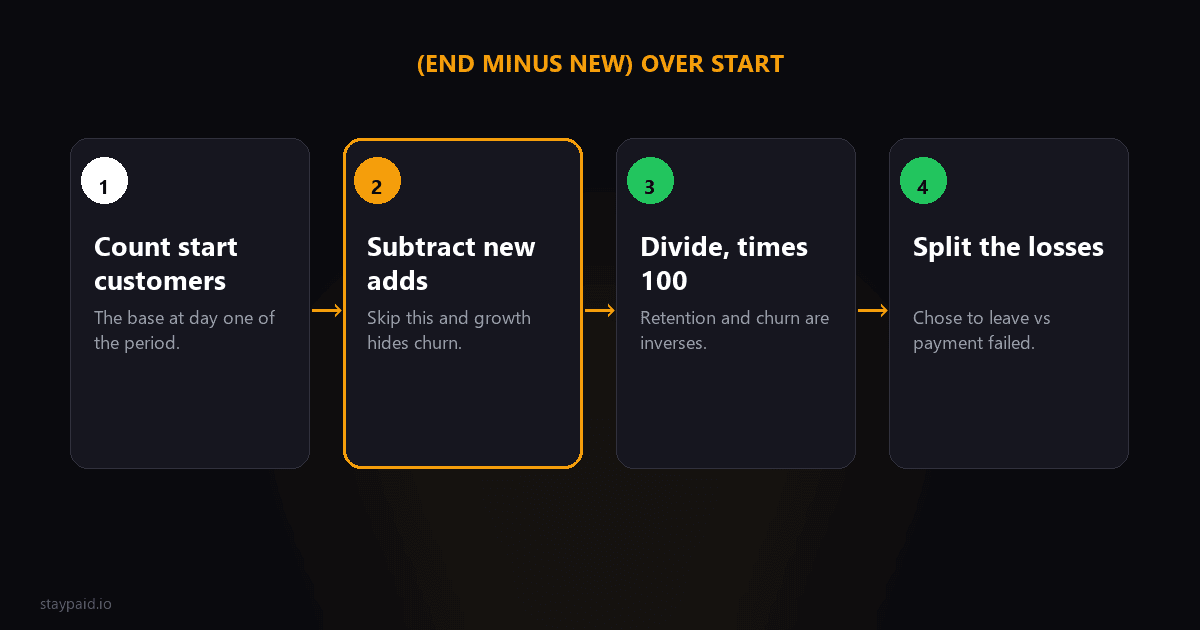
Retention rate = ((customers at the end of a period, minus new customers added during it) / customers at the start) x 100. That subtraction of new customers is the whole game: skip it and your growth hides your churn.
The formula takes ten seconds to learn. Using it correctly takes a bit more, because there are three common situations where the standard calculation feeds you a comfortable lie. Let's do the math properly, then look at the lies.
A worked example
You start March with 500 customers. During March you add 40 new ones. You end March with 512. How many did you lose, and what is your retention rate?
- •End customers: 512. New customers: 40. So retained from the original base: 512 - 40 = 472.
- •Lost from the original base: 500 - 472 = 28 customers churned.
- •Retention rate: (472 / 500) x 100 = 94.4%.
- •Churn rate (the inverse): 28 / 500 = 5.6% for the month.
Notice the trap the formula dodges: if you naively compared 512 to 500, you would think you grew and nothing bad happened. You actually lost 28 customers; the 40 new ones just covered the hole. This is why the new-customer subtraction is non-negotiable.
The cohort version (the one that diagnoses)
Aggregate retention tells you the weather; cohort retention tells you the climate. Instead of one blended number per month, track each signup month separately: of the customers who joined in January, what percent remain in February, March, June? Of those who joined in February?
Cohorts let you answer questions the blended number cannot touch. Did the customers you acquired from that big launch retain worse than organic signups? Did the onboarding change in April improve the May cohort's month-1 retention? Blended averages bury all of this under your growth rate.
Three ways this number lies to you
- •The growth mask. In a fast-growth quarter, your base is stuffed with new customers who have not had time to churn. Blended retention looks great. Then growth slows and the same underlying churn behavior suddenly looks terrible. Nothing about the product changed; the denominator did.
- •The annual-plan mirage. Customers on annual plans cannot churn for up to 12 months, so monthly retention looks stellar until the renewal cliff arrives. If a big slice of your base is annual, your monthly retention number is measuring your billing schedule, not your product.
- •The involuntary mix-up. Failed payments that lapse into cancellations get counted as churn, which is technically true but practically misleading. Those customers never decided to leave. If you read the number as "customers rejecting the product" you will go fix onboarding when the actual leak is a declined card and a mishandled retry.
Logo retention vs revenue retention
One more split worth making: count customers and count dollars separately. Logo retention asks how many relationships survived. Revenue retention asks how much money survived, and it can run above 100% when upgrades and seat expansions outpace losses.
The dangerous pattern is the divergence: revenue retention at 105% while logo retention slides to 90%. That means a shrinking base of bigger spenders is carrying the number. It looks healthy on the investor update and is fragile in reality, because every logo you lose is now a bigger percentage of your customer base than it was last year.
Monthly vs annual: pick your period deliberately
The formula works over any period, but the period changes what the number means. Monthly retention is the operational number: sensitive enough to catch a leak within weeks, noisy enough that one bad Tuesday does not panic you. Quarterly smooths the noise and matches how most teams review the business. Annual retention is the strategic number, the one that answers "if nothing changes, what fraction of today's customers will exist in three years," and at 94.4% monthly the honest answer is: about half. Compound your monthly rate for a year sometime. (0.944 to the twelfth power is 0.50.) That exercise ends a lot of complacency.
Whatever period you choose, stay consistent. Comparing this month's retention to last quarter's annualized number is how teams talk themselves into thinking things are fine.
The spreadsheet setup that takes an hour
You do not need a metrics tool to start. Export customers from Stripe with created and canceled dates. In a sheet: starting count for the month, adds during the month, ending count. Three columns, one formula, one row per month. Add a fourth column that subtracts payment-lapsed losses from total losses, and you now have voluntary and involuntary retention side by side, which is the split that actually tells you what to fix.
The edge cases that bend the formula
Three populations need an explicit decision, or they quietly corrupt the number. Trial users: exclude them until they convert, because a trial that never started paying is not a lost customer. Paused subscriptions: pick a rule (I count pauses under 60 days as retained, anything longer as churned) and never change it mid-comparison. And reactivations: when a churned customer returns, they join as a "new" customer in the formula, which slightly understates true retention; fine, as long as you know it.
None of these choices are right or wrong. What is wrong is letting each month's spreadsheet answer them differently.
Make it a habit, not a project
The formula earns its keep when you run it monthly and look at the trend, not when you calculate it once for a pitch deck. A 94.4% that was 93.1% last quarter is a business getting healthier. The same number after three flat quarters is a leak you have normalized.
A closing note on who should see this number: everyone. Retention calculated in a founder spreadsheet and shared with nobody changes nothing. Put it where the team can see it, with the voluntary and involuntary split visible, and watch how the conversation shifts from abstract growth goals to the specific, fixable reasons customers leave. Metrics change behavior when they are seen.
One last arithmetic sanity check before you trust your sheet: retention plus churn must equal 100% for the same population in the same period. If your numbers say 94% retention and 8% churn, one of them is measuring a different group. That mismatch has embarrassed more than one board deck. Two minutes of cross-checking with a calculator beats discovering it in front of an investor or a co-founder.
And when the formula does show a leak, resist the urge to average it away or explain it away. Decompose first: by cohort, by plan, by churn reason. The aggregate number tells you that you have a problem; only the decomposition tells you whose problem it is to fix, and roughly how much money fixing it is worth.
And about that involuntary slice, since it is the one you can fix fastest: those are customers the formula counts as losses who never chose anything. Their card declined and the recovery process failed them. Plugging that leak is the cheapest retention-rate improvement available to any subscription business, which is the whole reason I built StayPaid: sane retries plus human-sounding emails from your real address, so customers who wanted to stay simply stay. Your retention rate moves without a single product change.
FAQ
What is the retention rate formula?
Retention rate = ((customers at end of period minus new customers added during the period) / customers at start of period) x 100. Subtracting new customers is the crucial step; without it, growth disguises churn and your retention rate looks better than reality.
What is a good retention rate for SaaS?
For SMB-focused SaaS, monthly customer retention of 95% or better (5% monthly churn) is a common bar, and best-in-class products run 97% or higher. Enterprise SaaS should be higher still. The trend of your own number matters more than any benchmark: a curve that improves quarter over quarter is the goal.
What is the difference between retention rate and churn rate?
They are inverses measuring the same thing from opposite sides. If you retain 95% of customers in a month, your churn rate is 5%. Retention rate frames it as what you kept; churn rate frames it as what you lost. Use whichever your team will actually look at, just be consistent.
Should I calculate retention by customers or by revenue?
Both. Customer (logo) retention tells you how many relationships you kept. Revenue retention tells you how much money you kept, and it can exceed 100% when expansions outpace losses. A business can have great revenue retention and mediocre logo retention, which means it is leaning on a shrinking base of big spenders.
Keep reading
Robert
Founder at StayPaid
Want to recover failed payments like a founder?
Start Free — First 3 recoveries